An Overview to Sabermetrics
by Johnny Kraft–
Baseball is boring has become a very common misconception. However, those people do not appreciate what makes the sport great. In fact, even baseball fans do not even understand the beauty of the sport. That is because most people have never heard of sabermetrics.
Sabermetrics is the empirical analysis of baseball, especially baseball statistics that measure in-game activity. Baseball writer and statistician Bill James, who defined it as the search for objective knowledge about baseball, coined the term sabermetrics.
James derived the term sabermetrics from the acronym SABR, which stands for the Society of American Baseball Research. SABR is an organization for the baseball community to better understand the game of baseball along with like-minded fans.
Sabermetrics only deal with objective matters about baseball such as “which player contributed most to the team’s offense?” as it uses a statistical approach to evaluate a player. It cannot solve subjective matters such as “who is your favorite player?” since sabermetrics was designed to establish multiple parameters to assess player performance in objective studies.
“Sabermetrics helps put things into context. It allows you to try to figure out who is valuable and who is not and what to do in certain situations. We’re looking at baseball with an intellectual rigor,” said MLB network studio host and known sabermetric believer, Brian Kenny.
The majority of baseball fans understand statistics like batting average, home runs and runs batted in (RBI), however, sabermetricians frequently reject these traditional baseball statistics as they believe they are not the most accurate measurements of player performance. For example, they reject batting average because it does not always correlate with runs scored. Sabermetric analysis says runs win games and the best measure of a player’s value is his ability to help his team score more runs than the other team. That is why sabermetrics has created much more valuable statistics to measure that than batting average.
“I grew up thinking batting average was the batting champ and the best pitcher was the wins leader. I’ve since learned better. I understand that’s not the case. They have a correlation to runs or preventing runs, but they don’t have the best correlation. You have to look for more context. I’m always puzzled when people say they love baseball and statistics and yet they haven’t evolved to this position. It’s a culture divide that soon will not exist,” Kenny said about the transition from traditional statistics to sabermetrics.
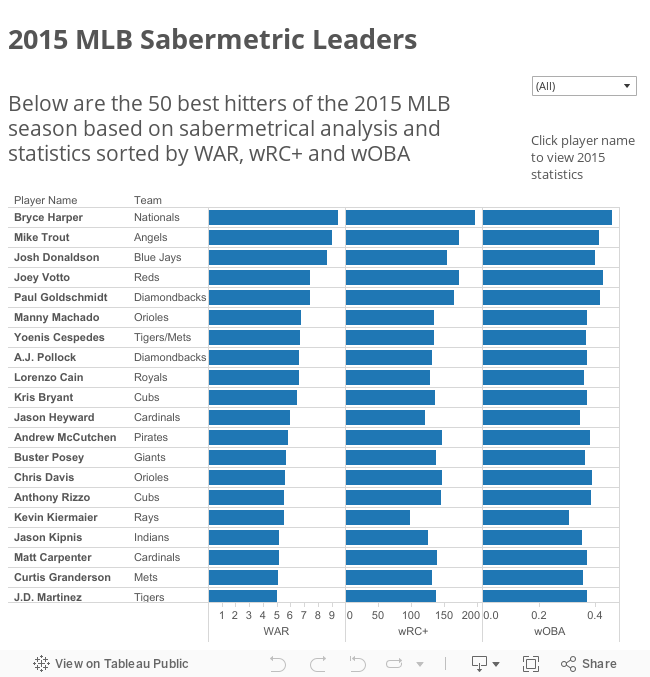
Now that you know the basics of sabermetrics, let’s dive into some of those valuable statistical categories that evaluate a player as noted in the 2015 sabermetric leaderboard graphic above. Each statistic has a complicated formula that even the biggest sabermetric fans struggle with, so this will just focus on explaining each important category rather than the process for calculating it. These are three of the most notable categories when it comes to sabermetric analysis.
The first important sabermetric category is called weighted on base average (wOBA), which combines all the different aspects of hitting into an offensive production metric by weighting each of them in proportion to their actual run value. As mentioned earlier, sabermetrics judge a player on their ability to help their team score more runs, and this category measures and captures offensive value more accurately than traditional measures.
Sabermetricians believe weighted runs created plus (wRC+) is the best and most comprehensive statistic to measure hitting and offensive performance. wRC+ takes into account the varying weights of each offensive action (such as wOBA), while also factoring in the ballpark and league context for which they took place.
“I’m a huge fan of wRC+, which is the stat I most frequently use. It’s an invaluable method for comparing players. It corrects for park and league effects, as well as running scoring environment of the era. This allows you to compare players not only to other modern players, but players from any era at all,” said SABR Director of Editorial Content, Jacob Pomrenke.
Sabermetrics use the plus to show the statistic as a ratio to league average, which is 100, so if a player has a 110 wRC+, that means the player’s runs created were 10% above league average. In the 2015 season, Nationals’ Bryce Harper led all of baseball with a 197 wRC+ putting him 97% above league average.
The final important sabermetric category is called wins above replacement (WAR), which is a comprehensive statistic that estimates the number of wins a player has been worth to his team compared to a freely available player such as a minor league free agent. It sums up the players total contributions both offensively as well as defensively to his team.
This is the number one stat used when determining the most valuable player to a team and league. As you can see, among the league leaders were National League MVP, Bryce Harper and American League MVP, Josh Donaldson as well as each league’s runner-up, Paul Goldschmidt and Mike Trout.
Other important sabermetrical categories include: isolated power (ISO), which is a measure of a hitter’s extra base power, as well as, batting average on balls in play (BABIP), which is the rate at which the batter gets a hit when he puts the ball in play (excluding balls not in play: strikeouts, home runs, walks, hit batters, etc.), which measure both the hitter and pitcher. There are also sabermetrics statistics that measure defensive and pitching performance as well.
“I think the advancement of defensive statistics in the past five years, with the implementation of PITCHf/x (pitch tracking system) and the upcoming MLB Advanced Media tracking system that was recently announced, has the potential to revolutionize our understanding of the game. I think defense is arguably the least understood aspect of baseball, so I enjoy seeing it get more attention,” Pomrenke said about the technological developments he is most pleased about in regards to the future of sabermetrics.
Sabermetrics has not only made its mark on baseball, but popular culture as well. The 2011 film, “Moneyball” was the story about Billy Beane’s use of sabermetrics to build the 2002 Oakland Athletics from the league’s lowest payroll to a division champion, as well as setting the American League record with a 20-game win streak. The film was based on the Michael Lewis’ book by the same name.
Sabermetrics and statistical analysis has changed and taken over the game of baseball by giving the baseball community an objective way to assess and evaluate every aspect of the game. Every baseball person who understands the game will tell you subjective matters such as the eye test are still crucial to the sport, however, those who use the combination of both to analyze the game are the only few who truly understand the beauty of baseball.
After all, baseball is our national pastime.